Install/Use
File Formats
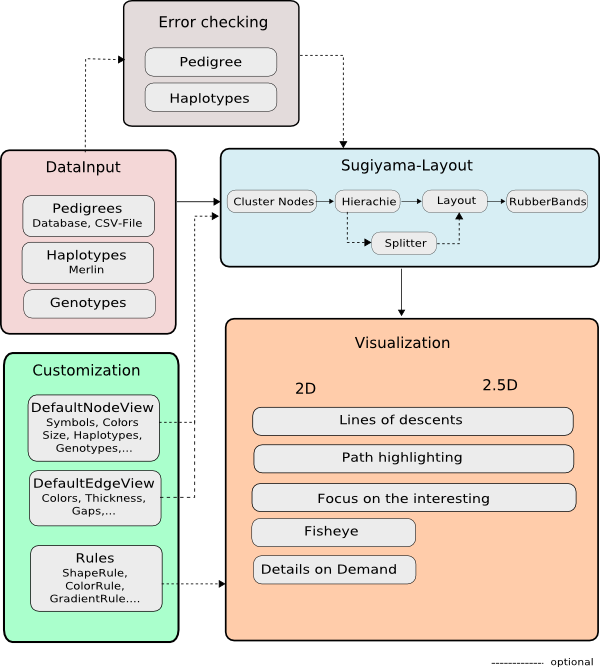
Overview
Functions
Java Doc
System requirements
Java VM 5.0/1.5 or higher Get Java
(To check Java version, type "java -version")
For 2.5D Visualization (additional): Java 3D v1.4.2 or higher and up-to-date graphics- card drivers.
- Download pedvizapi
pedviz_0.15.zip (2d + 2.5d + Rpedviz) OR for *NIX
pedviz_0.1.tgz (2d + 2.5d + Rpedviz)
- Extract the archive
bin...compiled classes
doc...java-doc
src...source code
pedviz_0.15.jar...java api for 2d visualization
pedviz_j3d_0.15.jar...java api for 2.5d visualization
family_32.csv...example pedigree
- Update the Java CLASSPATH
More information can be found here
or the classpath can be added during compilation
javac -classpath \pedviz_0.15.jar ...
execution:
java -classpath \pedviz_0.15.jar ....
For 2d visualization only pedviz_0.15.jar is needed.
- Get started!
- Download GetStarted.java and tutorial_data.csv
- Compile
javac -classpath .\pedviz_0.15.jar GetStarted.java
Maybe you have to adjust the path.
- Executing
java -classpath .\pedviz_0.15.jar;. GetStarted
Maybe you have to adjust the path.
|
|
csv format
|
Are composed of a header and data:
Id Fid Mid Sex aff trait1
1 2 3 2 2 4.4
...
Id, mom and dad id are mandatory and no special field ordering is needed, because of the required initial field mapping (Method: setSettings). Additional fields (that maybe are available in the data), such as sex, traits etc. are mapped as Rules. Different field separators can be definied.
For more information see "In use" or Functions.
|
|
Genotypes
|
Genotypes can be integrated by simple adding a column for each marker in the *.csv file
Id Fid Mid Sex aff GABRB1 D4S1645
1 2 3 2 2 7/7 7/10
2 0 0 1 1 / /
3 0 0 2 2 7/9 3/10
4 2 3 2 2 7/9 3/7
Then genotypes have to be added to the nodeview object:
nodeview.addSymbol(new SymbolGenotypes("GABRB1", "D4S1645"));
For more information see "In use" or Functions.
|
|
Haplotypes
|
The Merlin haplotype format is supported.
For more information see "In use" or Functions.
|
|
DB Connection
|
Data can be imported from any Java supported relational database. At the moment loader classes for mysql, hdbsql and postgresSQL are available. Furthermore, it's mandatory to set the mapping for the following fields: id, mom's id and dad's id (Method: setSettings). Additional fields (that maybe are available in the data), such as sex, traits etc. are mapped as Rules.
For more information see Functions.
pedviz.algorithms Provides differnt graph algorithms for the class graph.Graph.
pedviz.algorithms.filter Provides useful filters.
pedviz.algorithms.sugiyama Provides classes for the Sugiyama-algorithm implementation.
pedviz.event Provides classes for event handling.
pedviz.graph Provides a data structure for pedigrees.
pedviz.haplotype Provides some classes for haplotyping.
pedviz.loader Provides classes for loading data in a Graph object.
pedviz.rpedviz Provides classes for the integration of Pedviz in R (http://www.r-project.org).
pedviz.view Provides classes for visualizing a Graph object in different ways.
pedviz.view.animations Provides classes to create animations on a GaphView object.
pedviz.view.effects Provides different effects (like Fisheye) to transform a graph visualization.
pedviz.view.rules Provides classes for adapting the node's appearance.
pedviz.view.symbols Provides classes for displaying different pedigree symbols (2D).
pedviz.view.symbols3d Provides classes for displaying different pedigree symbols (3D).
In this section code-snippets for the important functions are given. Additional information can be found in the
JavaDoc
|
|
Loader
csv-file
Load genotypes
Load haplotypes
Connect to database
|
Visualization
2d Visualization
2.5d Visualization
2d Symbols
2.5d Symbols
Rules
|
Functions
Genotypes
Haplotypes
Error Checking
Fisheye
Details on demand
Lines of descent
|
|
csv-file |
Id, mom and dad id are mandatory and no special field ordering is needed, because of the required initial field mapping (Method: setSettings). Additional fields (that maybe are available in the data), such as sex, traits etc. are mapped as Rules. Different field separators can be definied. Family id's are not used for the drawing process.
	Graph graph = new Graph();
         // separator here ","
         CsvGraphLoader loader = new CsvGraphLoader("data.csv", ",");
         //mandatory basic field mapping
         loader.setSettings("PID", "MOM", "DAD");
	loader.load(graph);
|
| Load genotypes |
Load data as csv-file and then add marker as symbols.
	//creates a genotype symbol
Symbol2D symbol = new SymbolGenotypes("marker1", "marker2")); |
| Load haplotypes |
The Merlin haplotype format is supported.
	//import files
	MerlinHaplotypes haplotypes = new MerlinHaplotypes("merlin.chr", "pedigree.map");

	//optional with error highlighting
	MerlinErrorChecking merlinErrorChecking = new MerlinErrorChecking("merlin.err");
haplotypes.setErrors(merlinErrorChecking.getErrors()); |
| Connect to database |
Data can be imported from any Java supported relational database. At the moment loader classes for mysql, hdbsql and postgresSQL are available (MySQLDatabase(),HSQLDatabase(),PostgreSQLDatabase()).
	Database db = new HSQLDatabase();
	Graph graph = new Graph();
	if (db.connect("user", "pass", "connection-string")) {
                 //set the table name
		DatabaseGraphLoader loader = new DatabaseGraphLoader(db, "table");
                 //map id,mom id and dad id
                 loader.setSettings("pid-column", "mom-column", "dad-column");
                 //other fields will be loaded and can be used by added "Rules"
                 loader.load(graph);
		db.close();
} |
| 2d Visualization |
Visualizes the graph based on the Sugiyama-algorithm.
	Sugiyama s = new Sugiyama(graph);
	s.run();
	GraphView view = new GraphView2D(s.getLayoutedGraph());

	//integrate it into your Swing application
frame.add(view.getComponent()); |
| 2.5d Visualization |
Visualizes the graph based on the extended 2.5d Sugiyama-algorithm. The splitting of the nodes on the 2 layer can be done randomly or fields and values for the splitting can be defined (pedviz.algorithms.sugiyama.SicknessSplitter).
         //here random splitting is used
         Sugiyama s = new Sugiyama(graph, new RandomSplitter());
	s.run();
	GraphView view = new GraphView3D(s.getLayoutedGraph());

	//integrate it into your Swing application
frame.add(view.getComponent()); |
Genotypes
|
In the data available genotypes are simply drawn, by adding a genotype symbol with a list of markers.
	//creates a genotype symbol
	Symbol2D symbol = new SymbolGenotypes("marker1", "marker2"));
	//add to nodeview object
	nodeview.addSymbol(symbol);
|
Haplotypes
|
The haplotype visualization is based on the Merlin data format . The Merlin error output file can be used to highlight errors in the haplotype/genotype data.
	//import files
	MerlinHaplotypes haplotypes = new MerlinHaplotypes("merlin.chr", "pedigree.map");

	//optional with error highlighting
	MerlinErrorChecking merlinErrorChecking = new MerlinErrorChecking("merlin.err");
	haplotypes.setErrors(merlinErrorChecking.getErrors());

	//creates a haplotype symbol
nodeview.addSymbol(new SymbolHaplotypes(haplotypes)); |
Error Checking
|
The integrated method identifies the following basic errors: INVALID_SEX_DAD, INVALID_SEX_MOM, MISSING_DAD, MISSING_MOM, MULTI_PEDIGREES, SINGLETON
The automatic repair method fixes the first 4 problems by changing the sex or adding virtual individuals (ID starts with ##).
Additionaly, it's possible to process a Merlin error output file to highlight errors in the haplotype/genotype data.
	ErrorChecking errorChecking = new ErrorChecking(graph);
	errorChecking.run();
	//simple output of all errors (see GraphError)
System.out.println(errorChecking.getErrors()); Vector log = GraphRepair.repair(graph) |
Fisheye
|
	//creates fisheye-effect
	FisheyeEffect effect = new FisheyeEffect(5, 5, 2);
	effect.setMinSize(4f);
	effect.setAutoUpdateOnMove(false);
	effect.setAutoUpdateOnDrag(true);
	effect.setSpeed(3);

	graphView.setEffect(effect);
	graphView.setZoomEnabled(false);
graphView.setMovingEnabled(false); |
| 2d Symbols |
Available symbols:
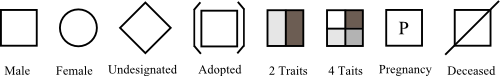 Symbols for all nodes:
	nodeview.addSymbol(new SymbolSexUndesignated());
	//you can combine different symbols (see Symbol.getPriority())
nodeview.addSymbol(new SymbolDeceased()); graphView.addRule(new ShapeRule("sex", "2", new SymbolSexMale()));
graphView.addRule(new ShapeRule("sex", "1", new SymbolSexFemale()));
graphView.addRule(new ShapeRule("dead", "1", new SymbolDeceased()));
graphView.addRule(new ShapeRule("adopted", "1", new SymbolAdopted())); |
| 2.5d Symbols |
Symbols for all nodes:
	nodeview.addSymbol(new SymbolSexUndesignated3d());
	//you can combine different symbols (see Symbol.getPriority())
nodeview.addSymbol(new SymbolDeceased3d()); graphView.addRule(new ShapeRule("sex", "1", new SymbolSexFemale3d()));
graphView.addRule(new ShapeRule("sex", "2", new SymbolSexMale3d()));
graphView.addRule(new ShapeRule("dead", "1", new SymbolDeceased3d()));
graphView.addRule(new ShapeRule("adopted", "1", new SymbolAdopted3d())); |
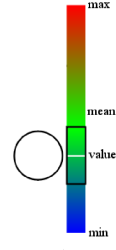
| Rules |
Rules can be used to integrate additional user data, such as qualitative and quantitative traits etc.
For more informations about rules see the tutorials section.
	//ShapeRule
	graphView.addRule(new ShapeRule("sex", "1", new SymbolSexFemale()));
	graphView.addRule(new ShapeRule(
		new SymbolQualitativeTrait("Energie", 0, 13, 6, 0)));

	//ColorRule
	graphView.addRule(new ColorRule("trait1", "1", Color.RED));

	//GradientRule
	HashMap colors = new HashMap();
	colors.put(0.0, Color.blue);
	colors.put(6.0, Color.green);
	colors.put(13.0, Color.red);
	graphView.addRule(new GradientRule("Energie", colors));
|
 |
| Details on demand |
Available user data, such as traits, personal information etc. can be shown on-demand by moving the mouse over the corresponding node.
Basic:
	nodeview.addHintAttribute("ID");
	nodeview.addHintAttribute("SEX");
nodeview.addHintAttribute("..."); graphView.addRule(new HintRule() {
//use \n for new line and {line} for a horizontal line
@Override
public String getHint(NodeView n) {
return n.getNode().getId() + "\n{line}\nsex: "
+ n.getNode().getUserData("SEX")
+ "\ndad: "
+ n.getNode().getIdDad()
+ "\nmom:"
+ n.getNode().getIdMom();
}
}); |
| Lines of descent |
Different types of lines of descent can be shown.
	//mode = Highlighter.MATERNAL | Highlighter.PATERNAL | Highlighter.MATERNAL_AND_PATERNAL |
	//Highlighter.ANCESTORS | Highlighter.SUCCESSORS | Highlighter.SUCCESSORS_AND_ANCESTORS
	LODHighlighter lodHighlighter = new LODHighlighter(mode);
graphView.addNodeListener(lodHighlighter); |
| Path between two individuals |
graphView.addNodeListener(new PathHighlighter()); |
| Focus on the interesting |
To down grade nodes of less interest their alpha value can be lowered.
	//sets the alpha-value for unimportant nodes.
	graphView.setAlpha(0.2f);
	graphView.hideAll();
	graphView.show(importantNode1);
	graphView.show(importantNode2);
... |