|
|
|
|
Summary
PedVizApi is a Java Api for the visual analysis of large and complex pedigrees. It provides all the necessary functionality for the interactive exploration of extended genealogies. Available packages are mostly focused on a static representation or cannot be added to an existing application; the goal of this open-source library is to provide an application program interface that enables the efficient construction of visual analytic applications for the analysis of family based data.
Why this library?
Pedigree drawing is a common task in population based genetics. However, most of the available programs are for stand-alone use only. The development of an effective pedigree visualization is a time-consuming task. Our library fills this gap by providing a fast, platform-independent implementation of a hierarchical graph drawing method for pedigrees. Furthermore, extensive interactive methods, based on the concept of "Visual Analytics", are integrated.
Visual Analytics
The principle of "Visual Analytics" [1] is to combine the outstanding visual capabilities of humans with the power of analytical methods to support the knowledge discovery process. Most importantly, the user is not only an interpreter of visual and analytical output, but takes an active role in driving the whole process.Therefore, according to [1], the visualization must:- Facilitate the understanding of large heterogeneous data sets
- Support the understanding of uncertain and incomplete data
- Provide adaptive representation for different user-tasks.
- Support different data types on various levels of abstraction into a single representation.
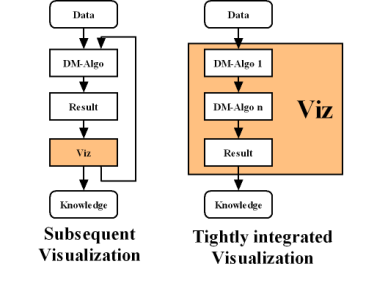
Furthermore, as it can be seen from the following figure, the visualization is not more a separated task (subsequent analysis), butis tighlty integrated in the whole analysis process.
Our API supports the information visualization mantra by Daniel Keim [2]: "Analyse First - Show the Important - Zoom, Filter and Analyse Further - Details on Demand".- Analyse First: Application of different pre-processing techniques; database queries; machine learning etc.
 Show the Important: Depending on the research question different information is needed and has to be included inthe pedigree drawing. The integration of qualitative data is a basic task. However, recently the analysis ofquantitative traits became more and more important. Show the Important: Depending on the research question different information is needed and has to be included inthe pedigree drawing. The integration of qualitative data is a basic task. However, recently the analysis ofquantitative traits became more and more important.- Zoom, Filter and Analyse Further: The explorative process is supported by a range of tools, such as zoom, move, rotate, incline(only for the 2.5D visualization) and dynamic querying.
- Details on Demand: During the explorative process additional information is required. On the one hand, static data can be retrieved from a data repository and displayed on demand, for example, by focusing on a single individual, details are shown. On the other hand on the fly calculated information, like the connection path between two individuals, are quite helpful.
More demos can be found in the "In use" section.
[1] Thomas JJ and Cook KA. A Visual Analytics Agenda, IEEE Computer Graphics and Applications 2006: 26(1): 10-13.
[2] Keim D. Summary. Workshop on Visual Analytics. Darmstadt, Germany, 2005.
Features- 2d and 2.5d layout
- visualization of very large pedigrees (>5,000 individuals)
- fast
- cross-plattform ready (2d all Java enabled plattforms; 2.5d all Java3d enabled plattforms)
- visual-compression
- different data sources, such as .csv and various relational databases
- large set of standard pedigree symbols integrated (for both: 2d and 2.5d)
- easy selection of interesting families
- jpeg output
- visualization of quantitative traits
- wide range of interactive exploration methods like: zoom, scrolling, rotation, path highlighting, details on demand.
Implementation
For the proper interpretation of pedigree based data a clear, line crossing reducing layout is needed. Our drawing algorithm is based on the 3 phase Sugiyama-heuristic. At the first phase the graph hierarchy based on the individual's generations are build. Then line crossings between the single layers are minimized by applying the barycentre method. Finally for any node of the resulting graph screen coordinates have to be calculated; therefore we integrated the rubber-band algorithm [1, 2]. All algorithm implementations are speed optimized to handle large genealogies. The 2.5D visualization is based on [3]. For more details please check out the source code.
[1] Sugiyama K, Tagawa S, Toda M. Methods for Visual Understanding of Hierarchical Systems. IEEE Transactions on Systems, Man, and Cybernetics 1981: 2: 109-25.
[2] Kaufmann M, Wagner D. Drawing graphs. Berlin: Springer, 2001.
[3] Hong SH, Nikolov NS. Layered Drawings of Directed Graph in Three Dimensions. National ICT Australia Ltd., 2004.
System requirements
Java VM 5.0/1.5 or higher Get Java
(To check Java version, type "java -version")
For 2.5D Visualization (additional): Java 3D v1.4.2 or higher and up-to-date graphic card drivers.
PedVizApi in use
Jenti: An efficient tool for mining complex inbred genealogies.
Pattaro C. et al.The genetic study of three population microisolates in South Tyrol (MICROS): study design and epidemiological perspectives. BMC Medical Genetics 2007, 8:29
Reference
PedVizApi: A Java API for the interactive, visual analysis of extended pedigrees.
Christian Fuchsberger, Mario Falchi, Lukas Forer, Peter Pramstaller
Bioinformatics 2008 24: 279-281.
Acknowledgement
For suggestions and comments: Cristian Pattaro, Clemens Egger, Fabio Marroni, Jim Hunter and Silvia Miksch.
This work was supported by the Ministry of Health of the Autonomous Province of Bolzano and the South Tyrolean Sparkasse Foundation.

GPL License
Copyright © 2007 by Christian Fuchsberger and Lukas Forer info@pedvizapi.org. All rights reserved.
This program is free software; you can redistribute it and/ormodify it under the terms of the GNU General Public Licenseas published by the Free Software Foundation; either version 2of the License.
This program is distributed in the hope that it will be useful, but WITHOUT ANY WARRANTY; without even the implied warranty of MERCHANTABILITY or FITNESS FOR A PARTICULAR PURPOSE.
See theGNU General Public License for more details.
|
|
|
|

|
|